Excel: Financial Modeling & Data Analysis | Anjani Kumar Mishra

My Excel Projects

A data-driven portfolio analysing 31K+ retail transactions, ₹43.9L in receivables, ₹27.98L in fixed assets, and 4,470 inventory SKUs — built for corporate finance, variance analysis, and reporting efficiency.

Financial Modeling and Analysis Projects

vrinda_analysis.xlsx
Home Insert Formulas Data Review
fx
=PROJECT("Vrinda Store", "Retail Dashboard")

Vrinda Store Analysis

31K-transaction retail analytics dashboard for Vrinda Store's 2022 annual report. Women drive ~64% of sales (₹13.6M vs ₹7.6M men), Amazon leads channels at 35.5%, and Maharashtra tops state revenue at ₹3M. Monthly trends show peak of ₹1.93M in March with a seasonal decline to ₹1.62M by December. Built with pivot tables, XLOOKUP, and conditional formatting.

Revealed that women contribute 64% of total revenue (₹13.6M) and top-3 states (Maharashtra, Karnataka, Uttar Pradesh) generate 36% of all sales. Amazon + Myntra capture 59% of channel volume. A ₹3L revenue gap between March's peak and Q4 trough informed targeted seasonal promotions. Return rate at 3.3% drove vendor quality reviews.
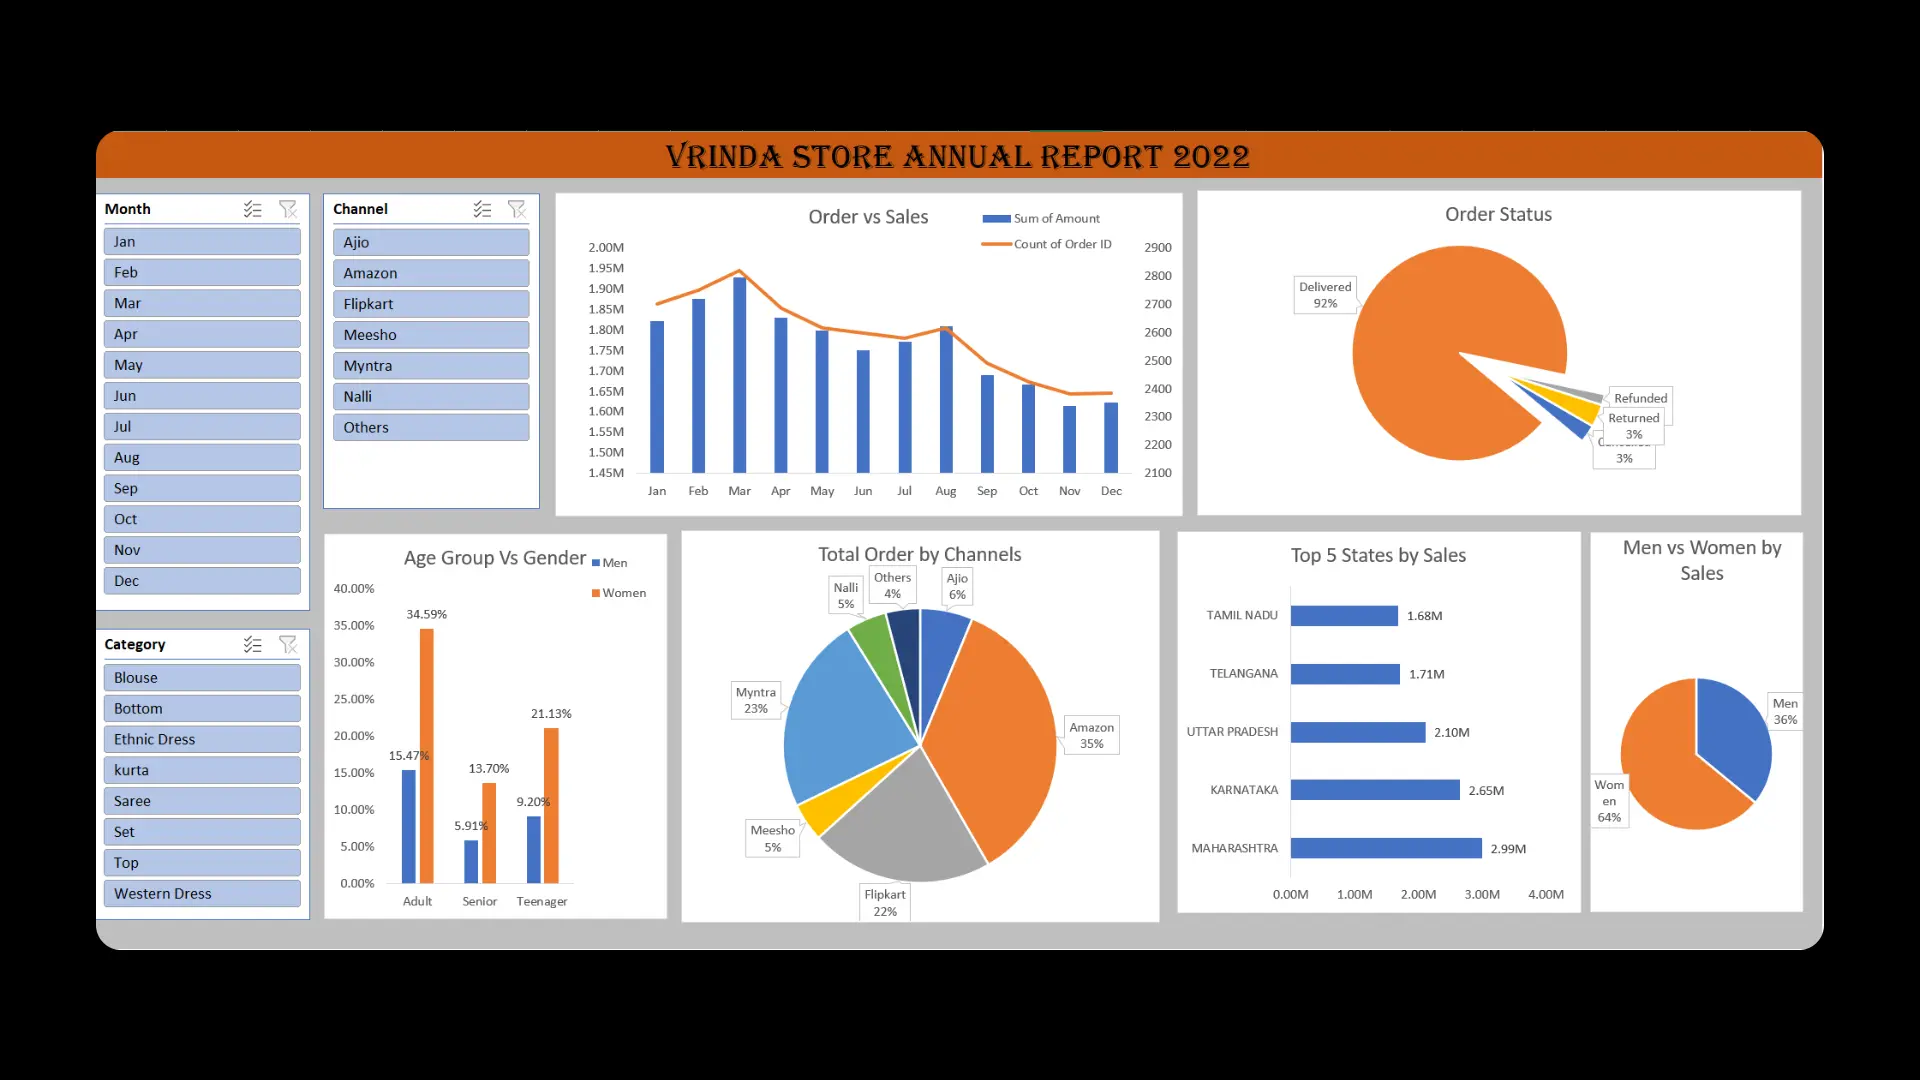
Vrinda Store
Download Model
ar_aging.xlsx
Home Insert Formulas Data Review
fx
=TRACK(Invoices, Aging_Buckets)

AR Aging Report

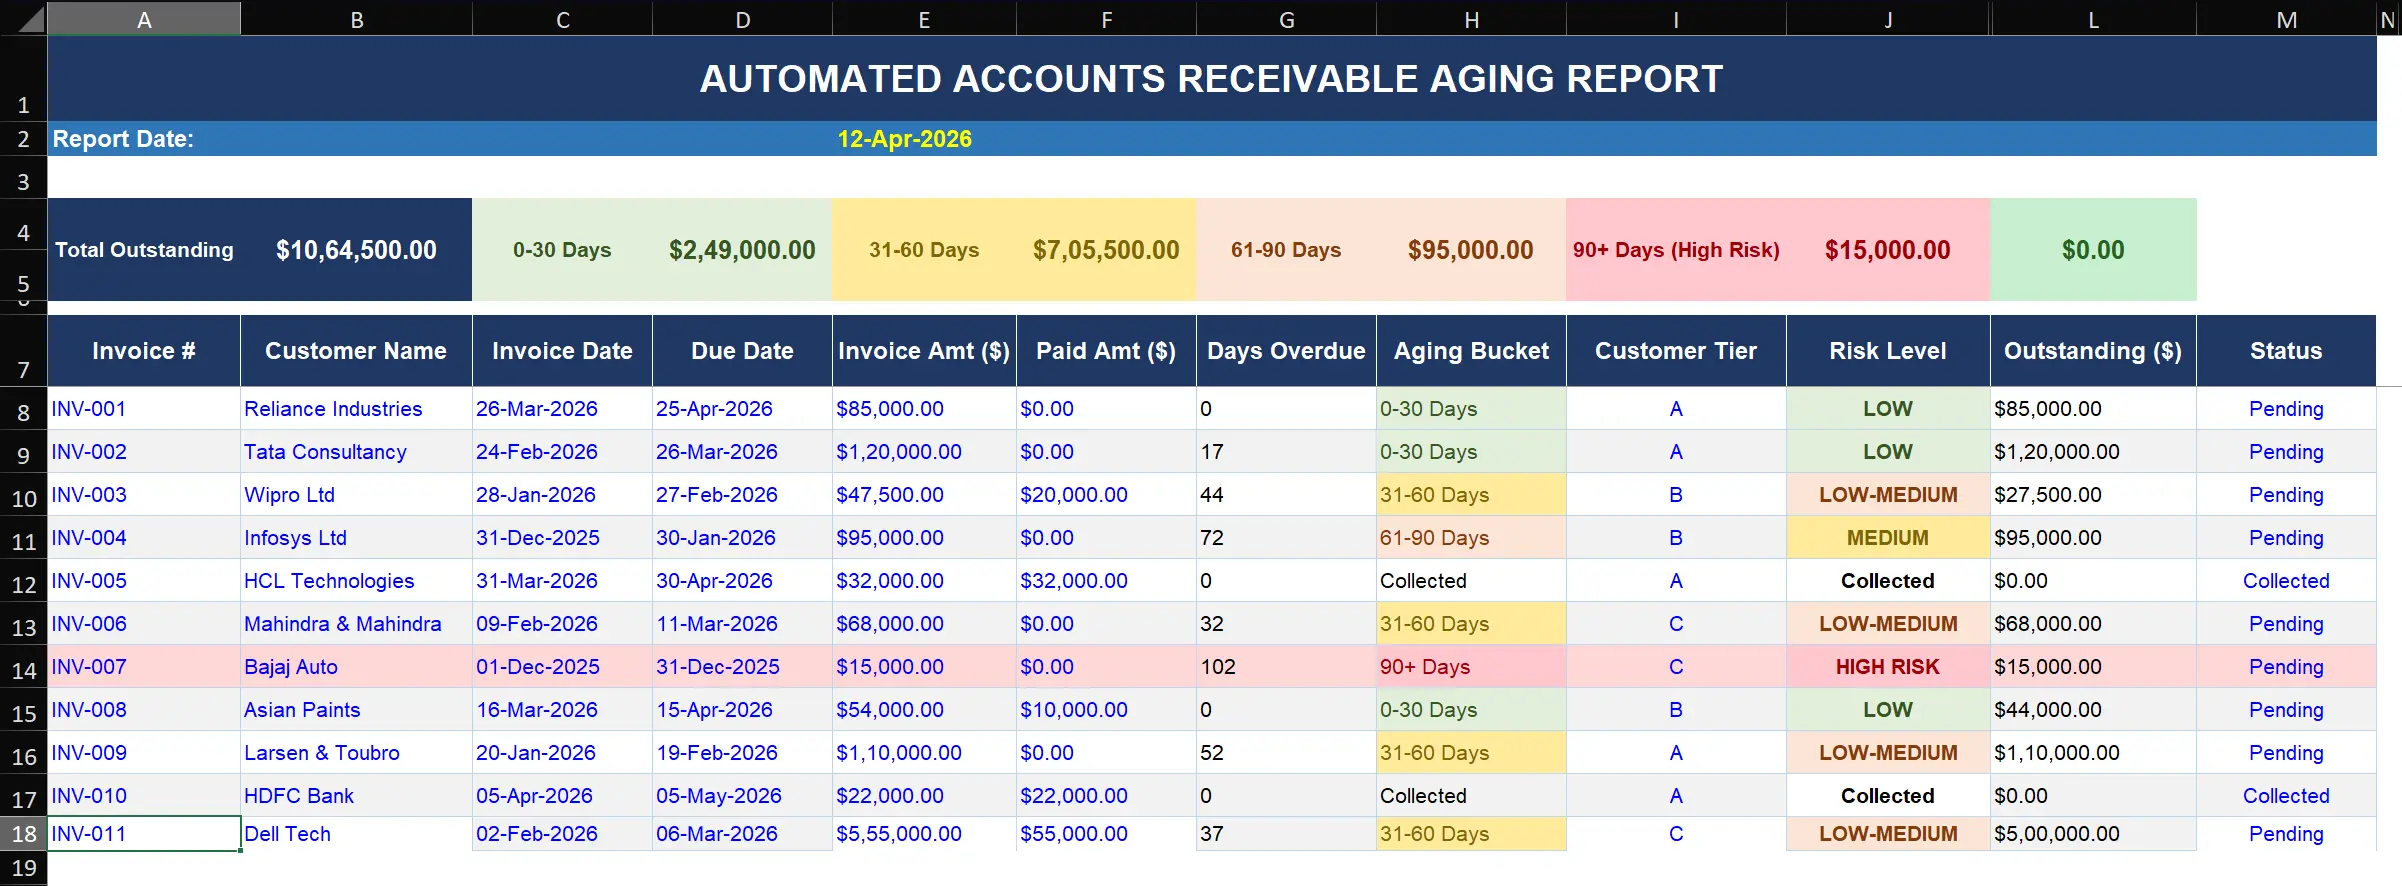
Automated AR aging tracker monitoring ₹43.9L in outstanding receivables across 12 invoices. 81.4% (₹35.7L) sits in the 0-30 day bucket, while 90+ days high-risk exposure is limited to just ₹15K (0.3%). Features customer tiering, risk classification, and aging-bucket analysis for proactive collections.

Segregated ₹43.9L receivables into 4 aging tiers: 81.4% current, 16.1% watchlist (31-60 days), 2.2% at-risk (61-90 days), and 0.3% high-risk. With 91.7% of exposure concentrated in A/B-tier customers, collection prioritisation can reduce DSO by an estimated 12-15 days through targeted follow-up on the ₹8.2L in overdue invoices.
AR Aging
Download Model
dcf_valuation.xlsx
In Dev
Home Insert Formulas Data Review
fx
=NPV(WACC, FCF_Projections) + Terminal_Value

DCF Valuation Modeling

A standardized Discounted Cash Flow (DCF) model template featuring structured assumptions, WACC calculations, terminal value computations, and intrinsic value projections. Currently under active development.

Provides a standardized framework for equity valuation, enabling informed investment decisions through rigorous NPV and IRR analysis that quantifies the intrinsic value of a business.
fixed_assets.xlsx
Home Insert Formulas Data Review
fx
=CALCULATE_DEPRECIATION(Asset_Cost, Lifespan, "Straight-Line")

Fixed Asset Register

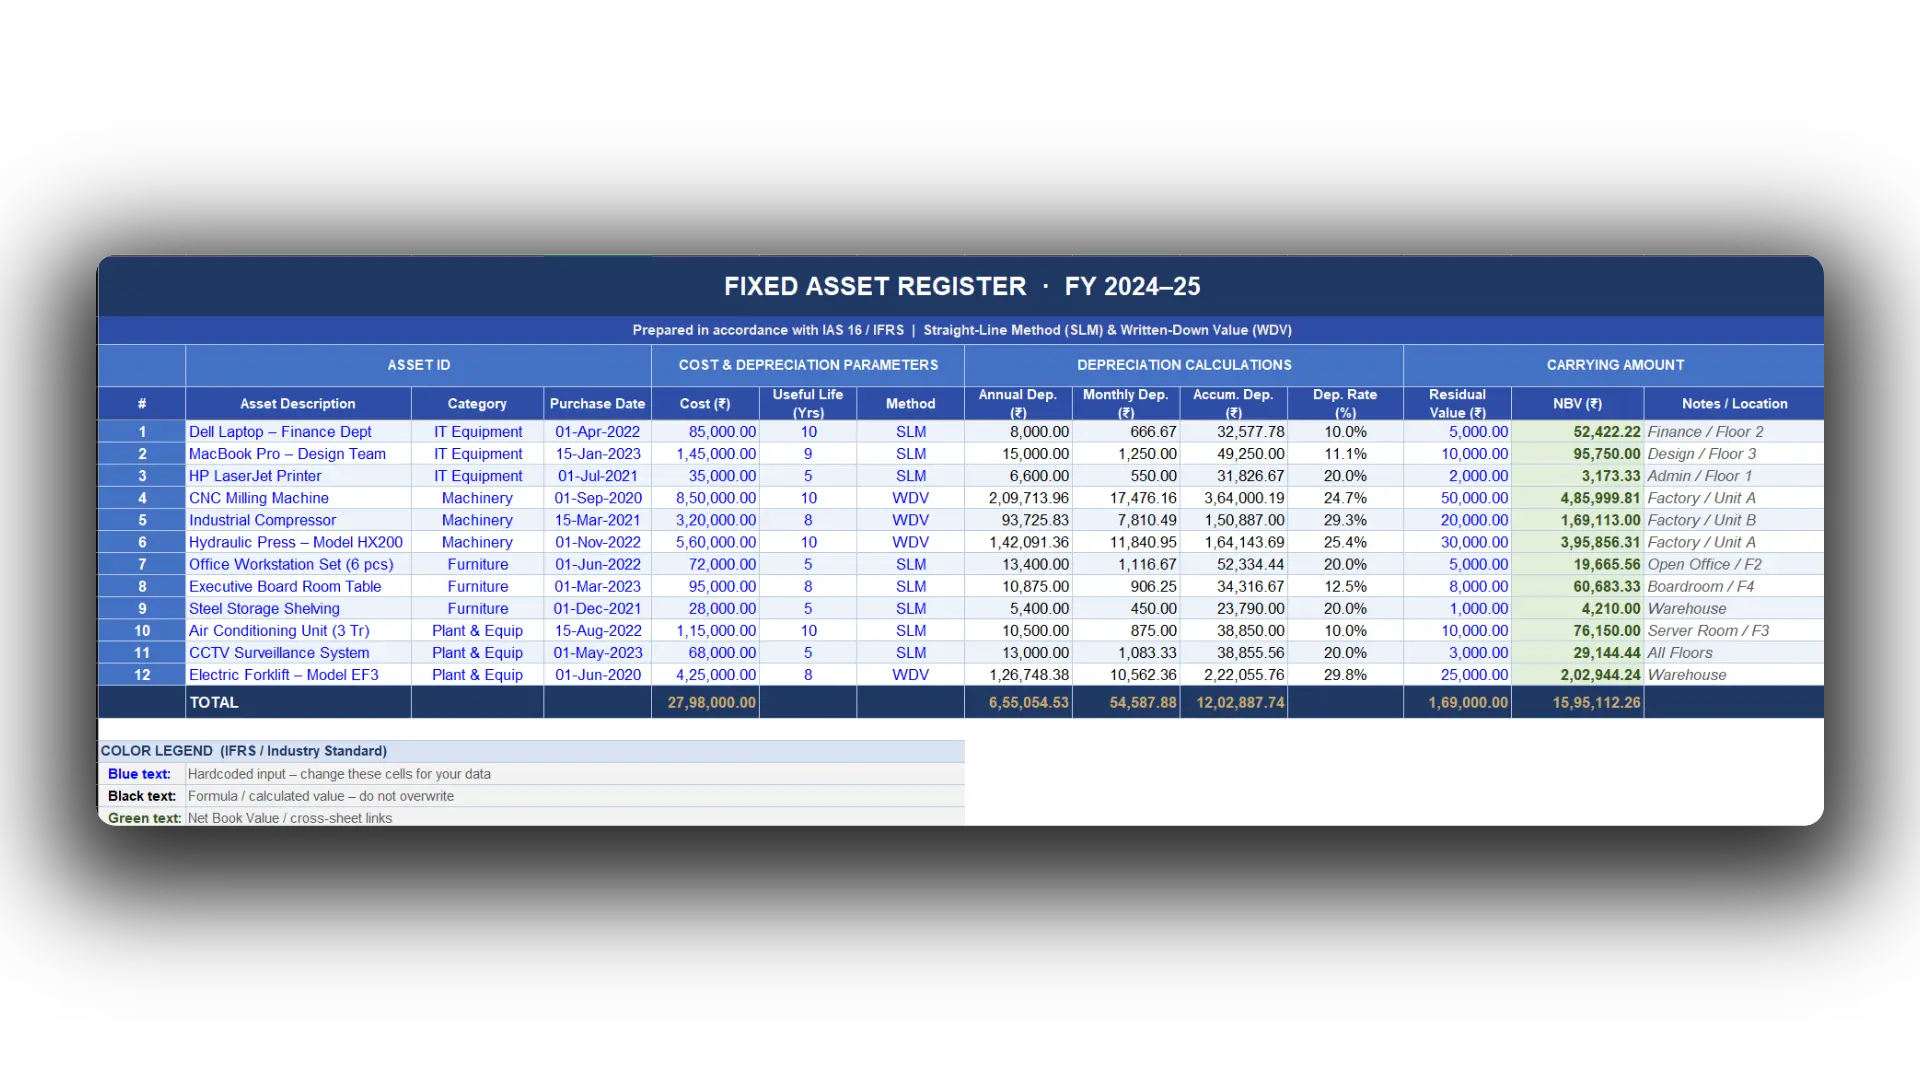
IAS 16-compliant fixed asset register tracking ₹27.98L in total assets across 12 items. Computes both SLM and WDV depreciation with monthly schedules, accumulated depreciation (₹11.95L), and net book value (₹16.03L). Covers IT equipment, machinery, furniture, and plant & equipment across departments.

Automated monthly depreciation schedules across 12 assets under IAS 16, producing a ₹54.6K/monthly charge and revealing 57.3% cost retention overall. Machinery holds the highest NBV at ₹10.55L (66% of total), while ageing IT equipment like the HP Printer (only 9.7% cost remaining) signals replacement triggers for CapEx planning.
Fixed Asset Register
Download Model
ai_audit.xlsx
Home Insert Formulas Data Review
fx
=IFERROR(AUDIT_MODEL(Data), "Discrepancy Found")

AI Fin-Model Audit

End-to-end financial model audit using advanced Excel logic and AI-assisted formula tracing to detect, flag, and rectify discrepancies across startup financial models — comparing audited vs. fixed versions side by side for transparent validation.

Reduced financial modeling errors through automated discrepancy detection, saving hours of manual review time and significantly enhancing the reliability of complex financial models.
AI Fin-Model Audit
data_cleaning.xlsx
Home Insert Formulas Data Review
fx
=TRIM(CLEAN(Raw_Data))

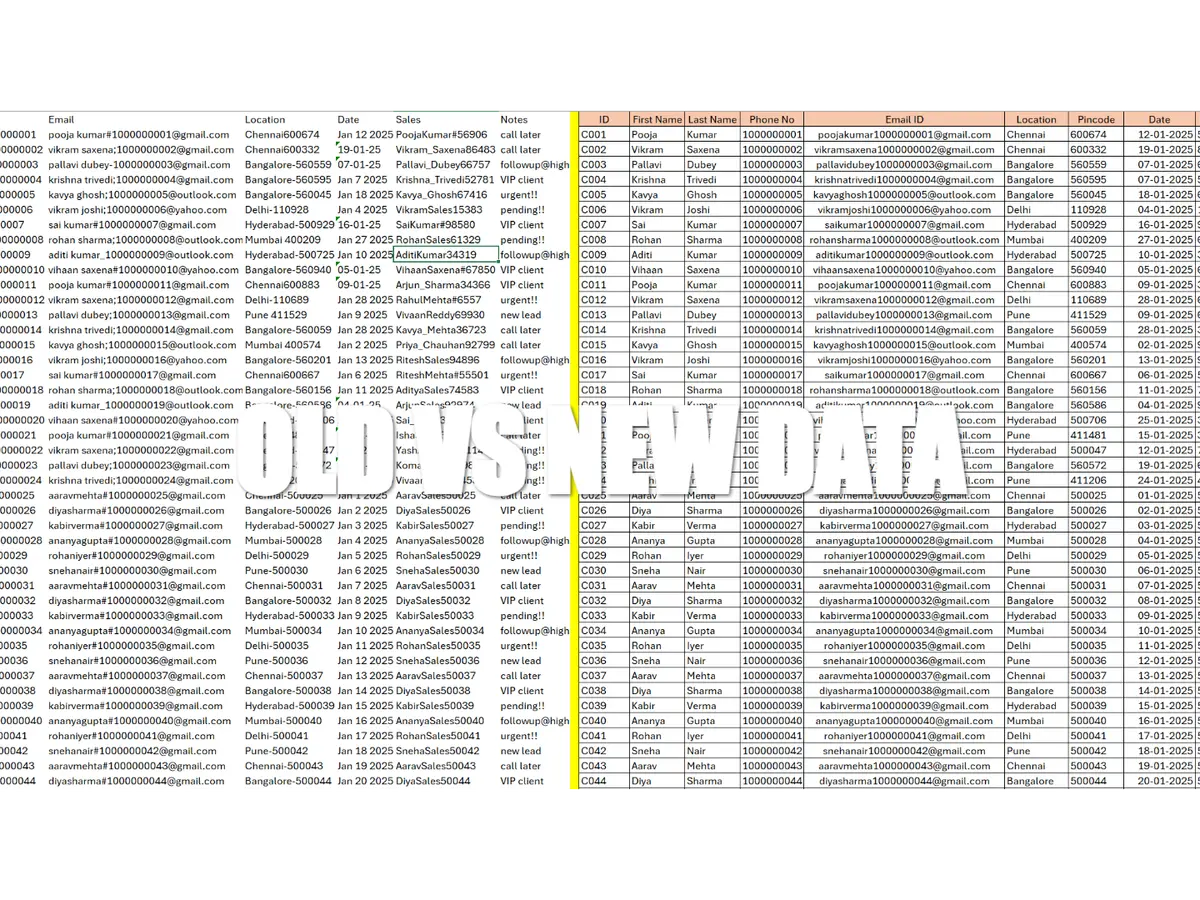
Data Cleaning Practice

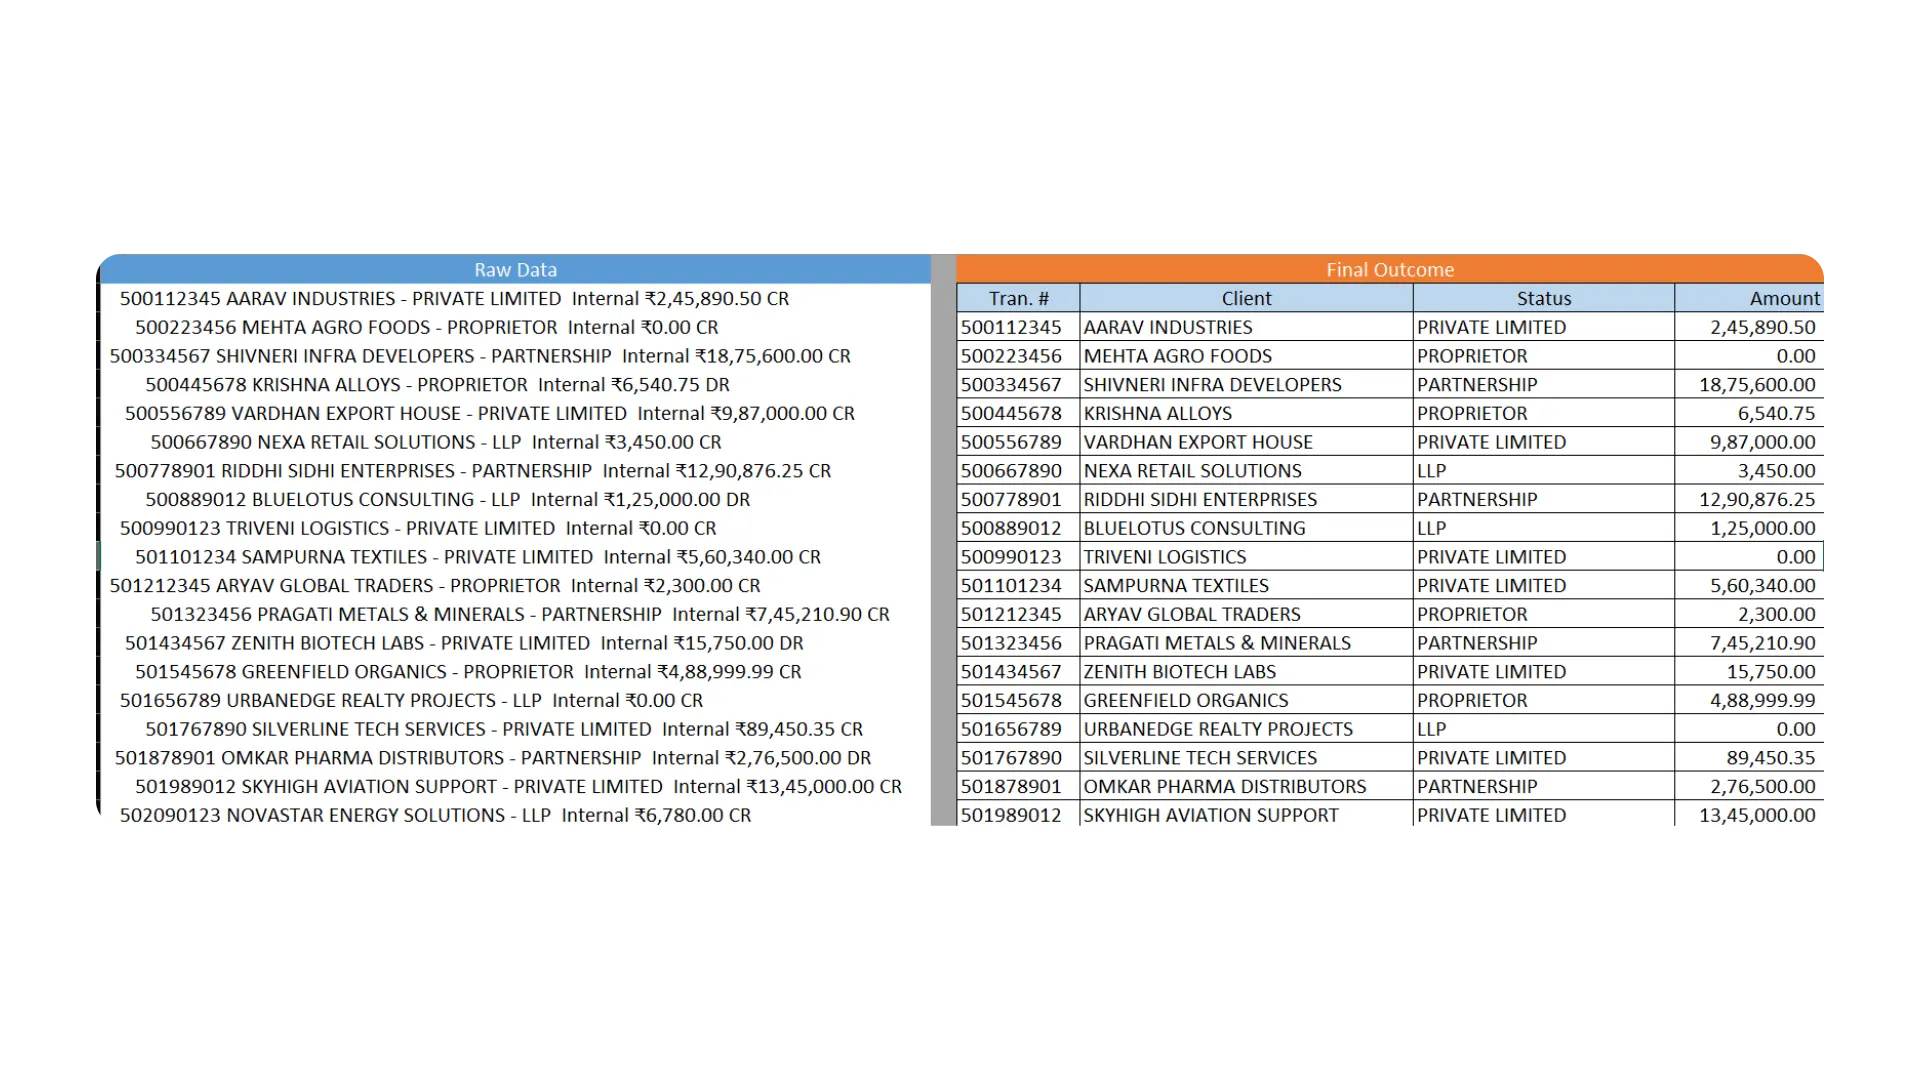
Hands-on exercises using Power Query, text functions (LEFT, RIGHT, MID), and advanced formulas (VLOOKUP, INDEX-MATCH) to transform raw data into analysis-ready formats.

Accelerated data preparation workflows by automating cleaning routines, reducing manual effort by over 60% and dramatically improving data quality for downstream analysis.
Data Cleaning Practice
Download Model
data_ai.xlsx
Home Insert Formulas Data Review
fx
=LAMBDA(x, MAP(x, CLEAN_DATA))

Data Cleaning AI

AI-powered data cleaning leveraging modern Excel functions (LAMBDA, LET, MAP, SCAN, BYROW) to automate data prep with intelligent pattern recognition and array-based transformation at scale.

Applied AI-powered Excel functions to automate complex data cleaning tasks at scale, slashing processing time from hours to minutes while minimizing human error.
Data Cleaning AI
restorex_efp.xlsx
Home Insert Formulas Data Review
fx
=RECONCILE(Firm_Pricing, Core_Statements)

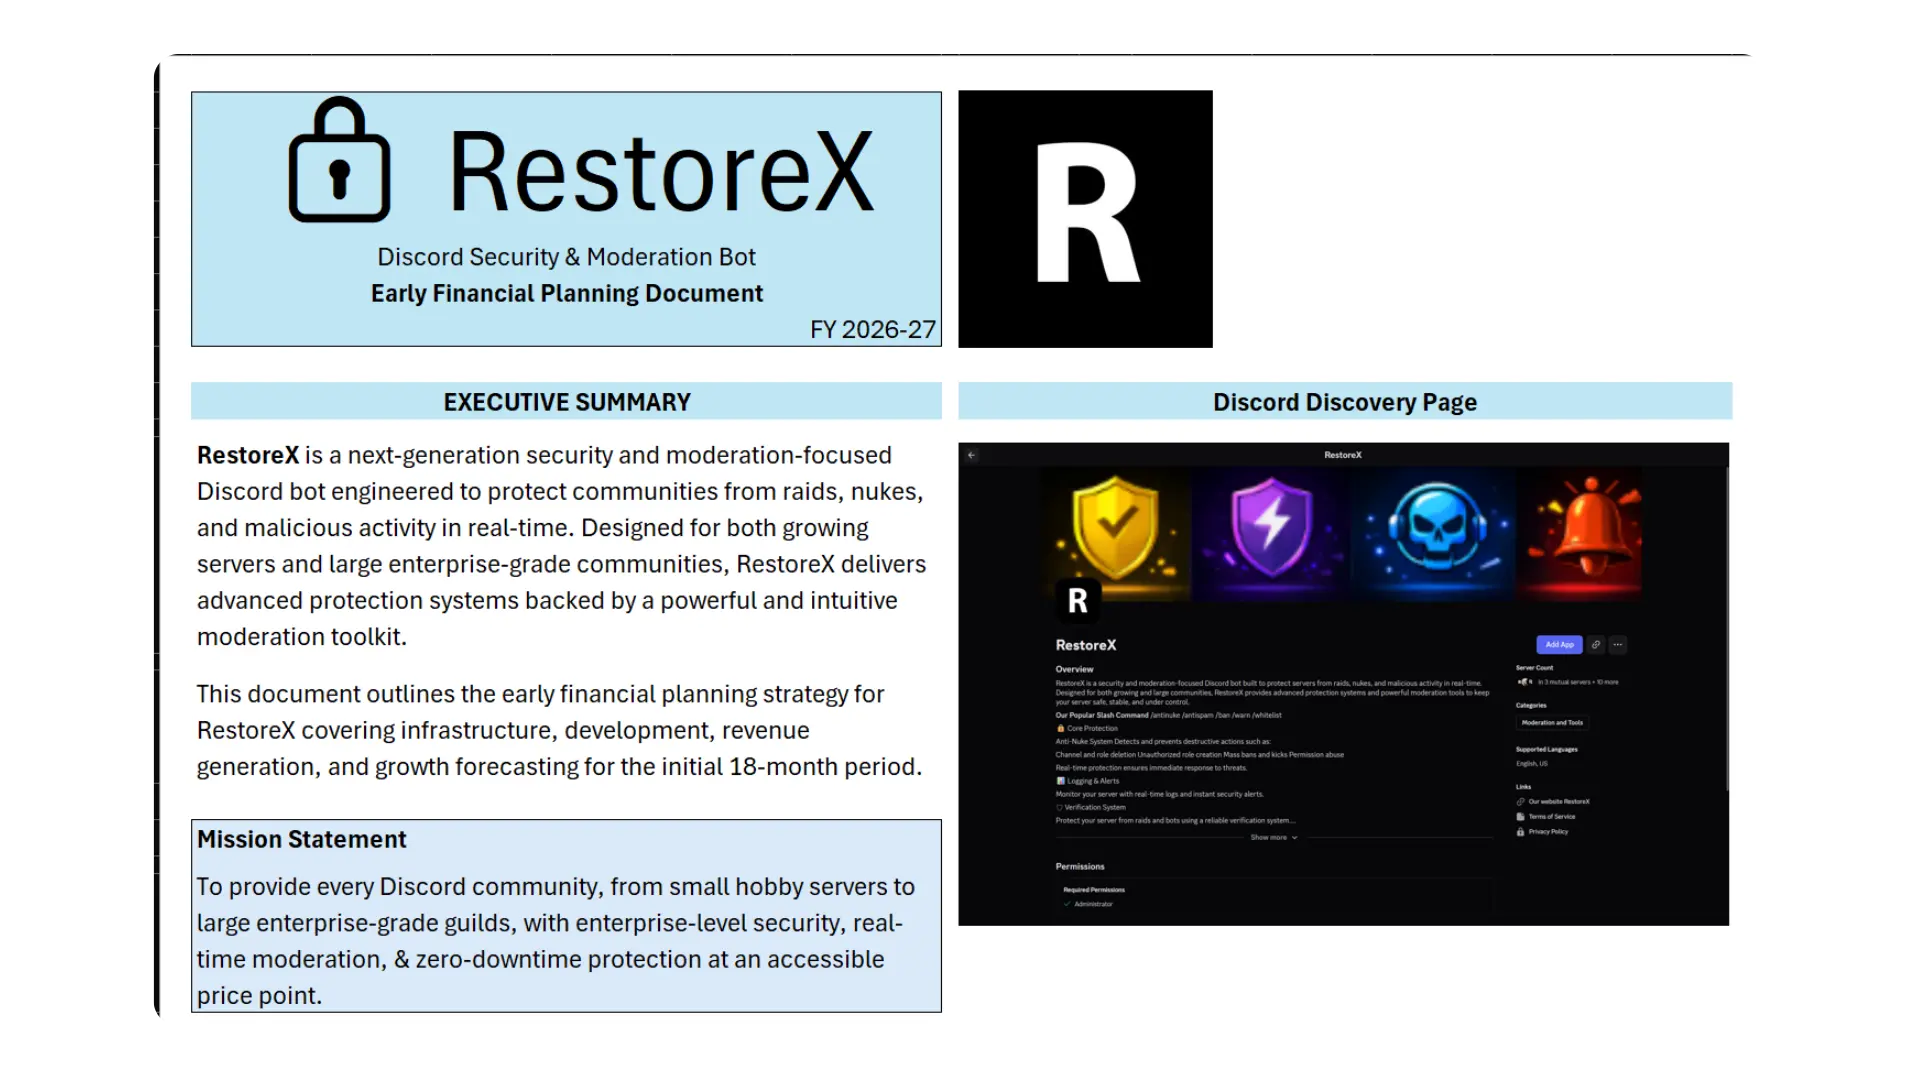
RestoreX EFP Model

Early Financial Planning model for RestoreX, a Discord bot project. Features financial tracking with cost/revenue projections, budgeting workflows, and resource allocation planning. Currently under active development.

Enabled early-stage financial planning and budgeting for a tech startup, providing clear visibility into projected costs, revenue streams, and resource allocation needs.
RestoreX EFP Model
Download Model
bartan_inventory.xlsx
Home Insert Formulas Data Review
fx
=CALCULATE(STR, Inventory, "Sell Through Rate")

Bartan Bazzar Inventory & STR

Cleaned 4,470 rows of messy, semi-structured Hindi-English inventory data using Power Query and text functions. Calculated Sell Through Rate (STR) and Stock Value across 14+ categories (Steel, Plastic, Glass, Cooker). Spoon Set tops STR at 80%, while Cooker 5L locks the highest stock value at ₹61.2K.

Revealed that Spoon Set (STR 80%), Storage Container (67%), and Plastic Bucket (63%) are top movers — while Glass Set (20%) and Steel Plate (40%) indicate overstocking risk. Total stock value analysis across 4,470 SKUs enabled data-driven reordering, potentially releasing ₹2-3L in working capital by reducing dead inventory.
Download Model
personal_portfolio.xlsx
In Dev
Home Insert Formulas Data Review
fx
=CALCULATE_NET_WORTH(Investments, Assets, Liabilities)

My Personal Portfolio

Comprehensive personal portfolio analysis tracking investments, net worth, asset allocation, and financial goals with interactive visualizations. Currently under active development.

Provides a comprehensive view of personal investment performance, asset allocation, and net worth tracking, enabling more informed and data-driven financial planning decisions.
autovba_expenses.xlsm
Home Insert Formulas Data Review
fx
=AUTO_VBA("Expense Dashboard", "AI 3-Min Build")

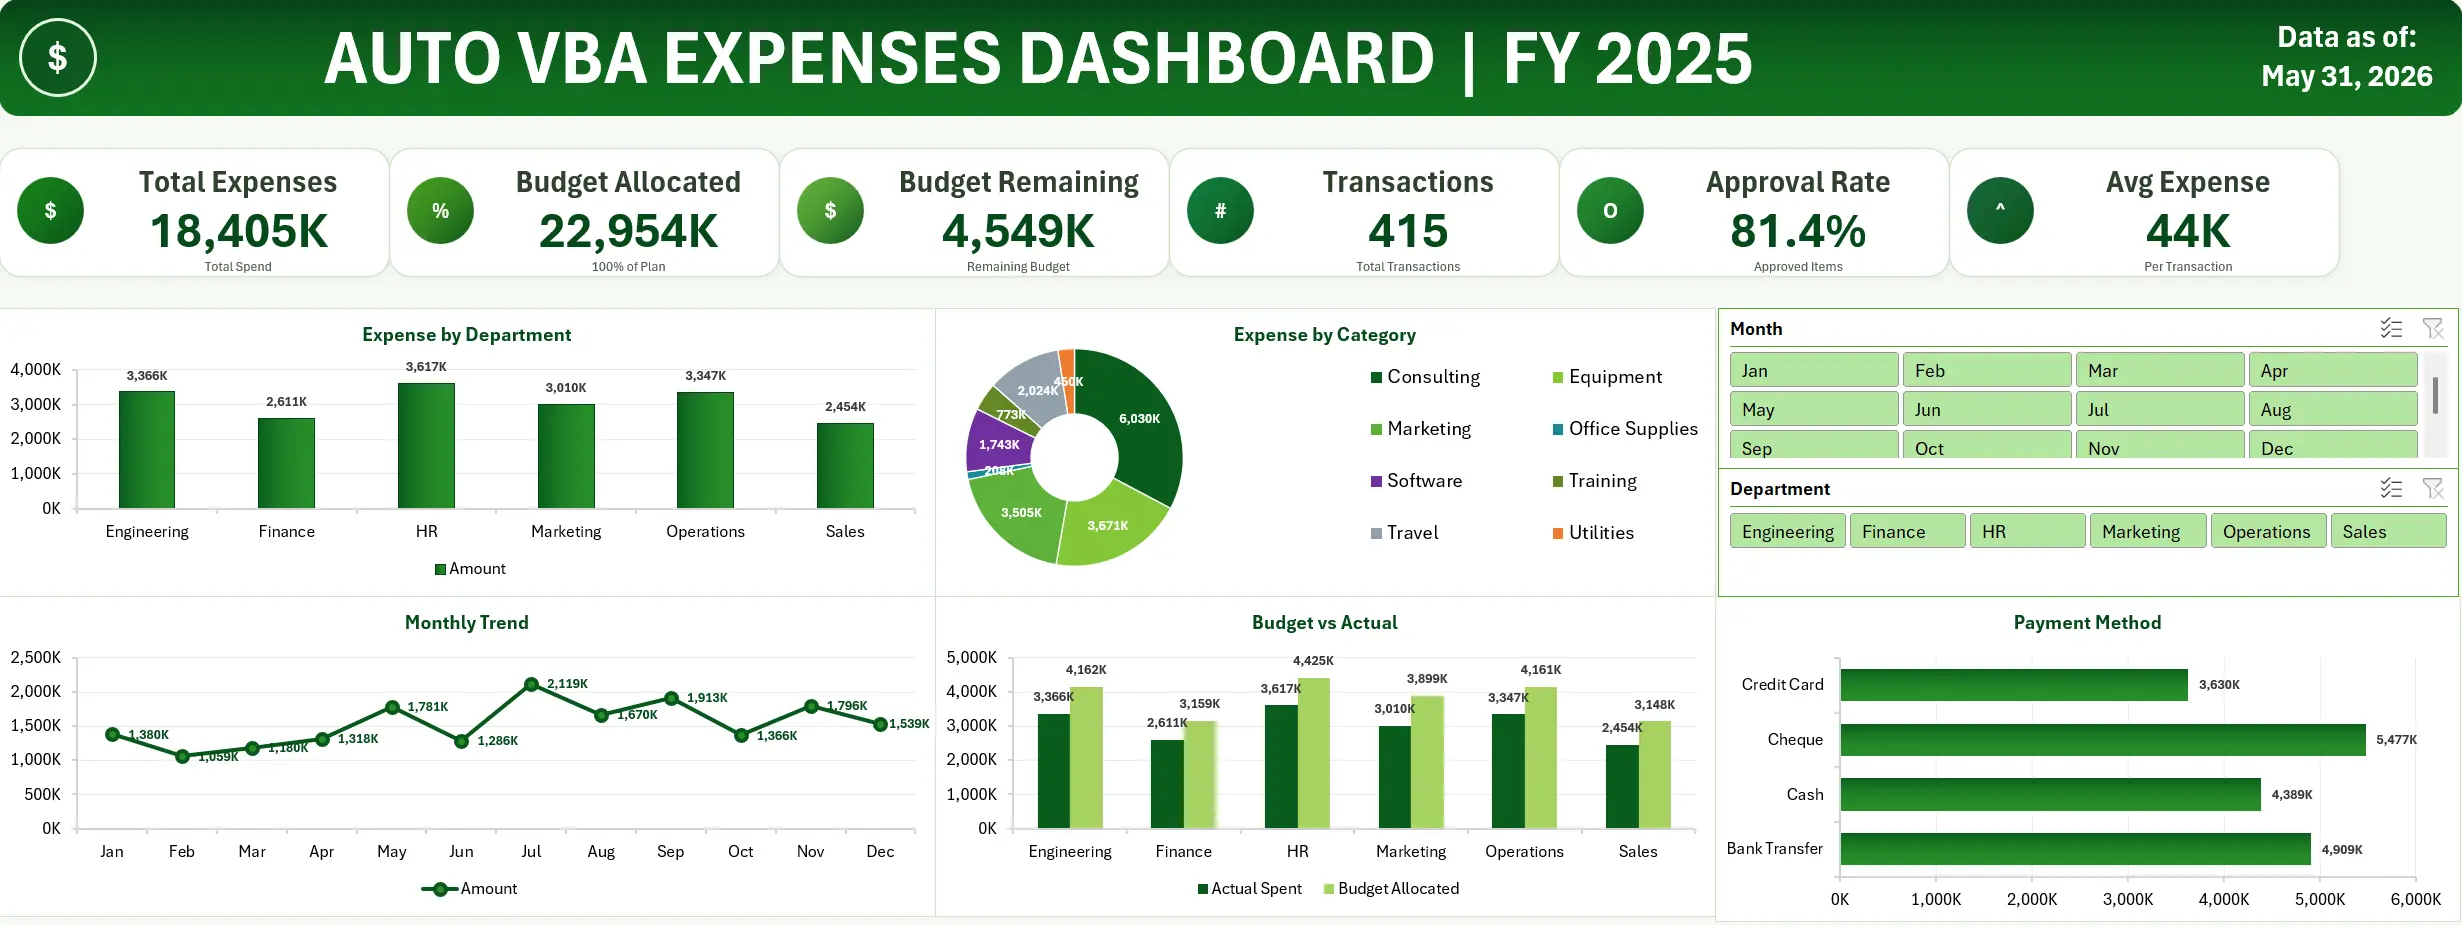
AUTOVBA Expenses Dashboard

An interactive expense dashboard generated entirely by AI — Claude AI was prompted to auto-generate VBA code that builds a fully functional Excel dashboard with dynamic charts, pivot summaries, and category-level expense insights in under 3 minutes. Demonstrates AI-assisted development for rapid financial tool prototyping, reducing build time from hours to minutes.

Demonstrated a 10x productivity gain by generating a fully functional, production-ready expense dashboard in under 3 minutes through AI-assisted VBA automation.
smart_inventory.xlsx
Home Insert Formulas Data Review
fx
=INVENTORY_OPTIMIZE(Stock_Data, Reorder_Point)

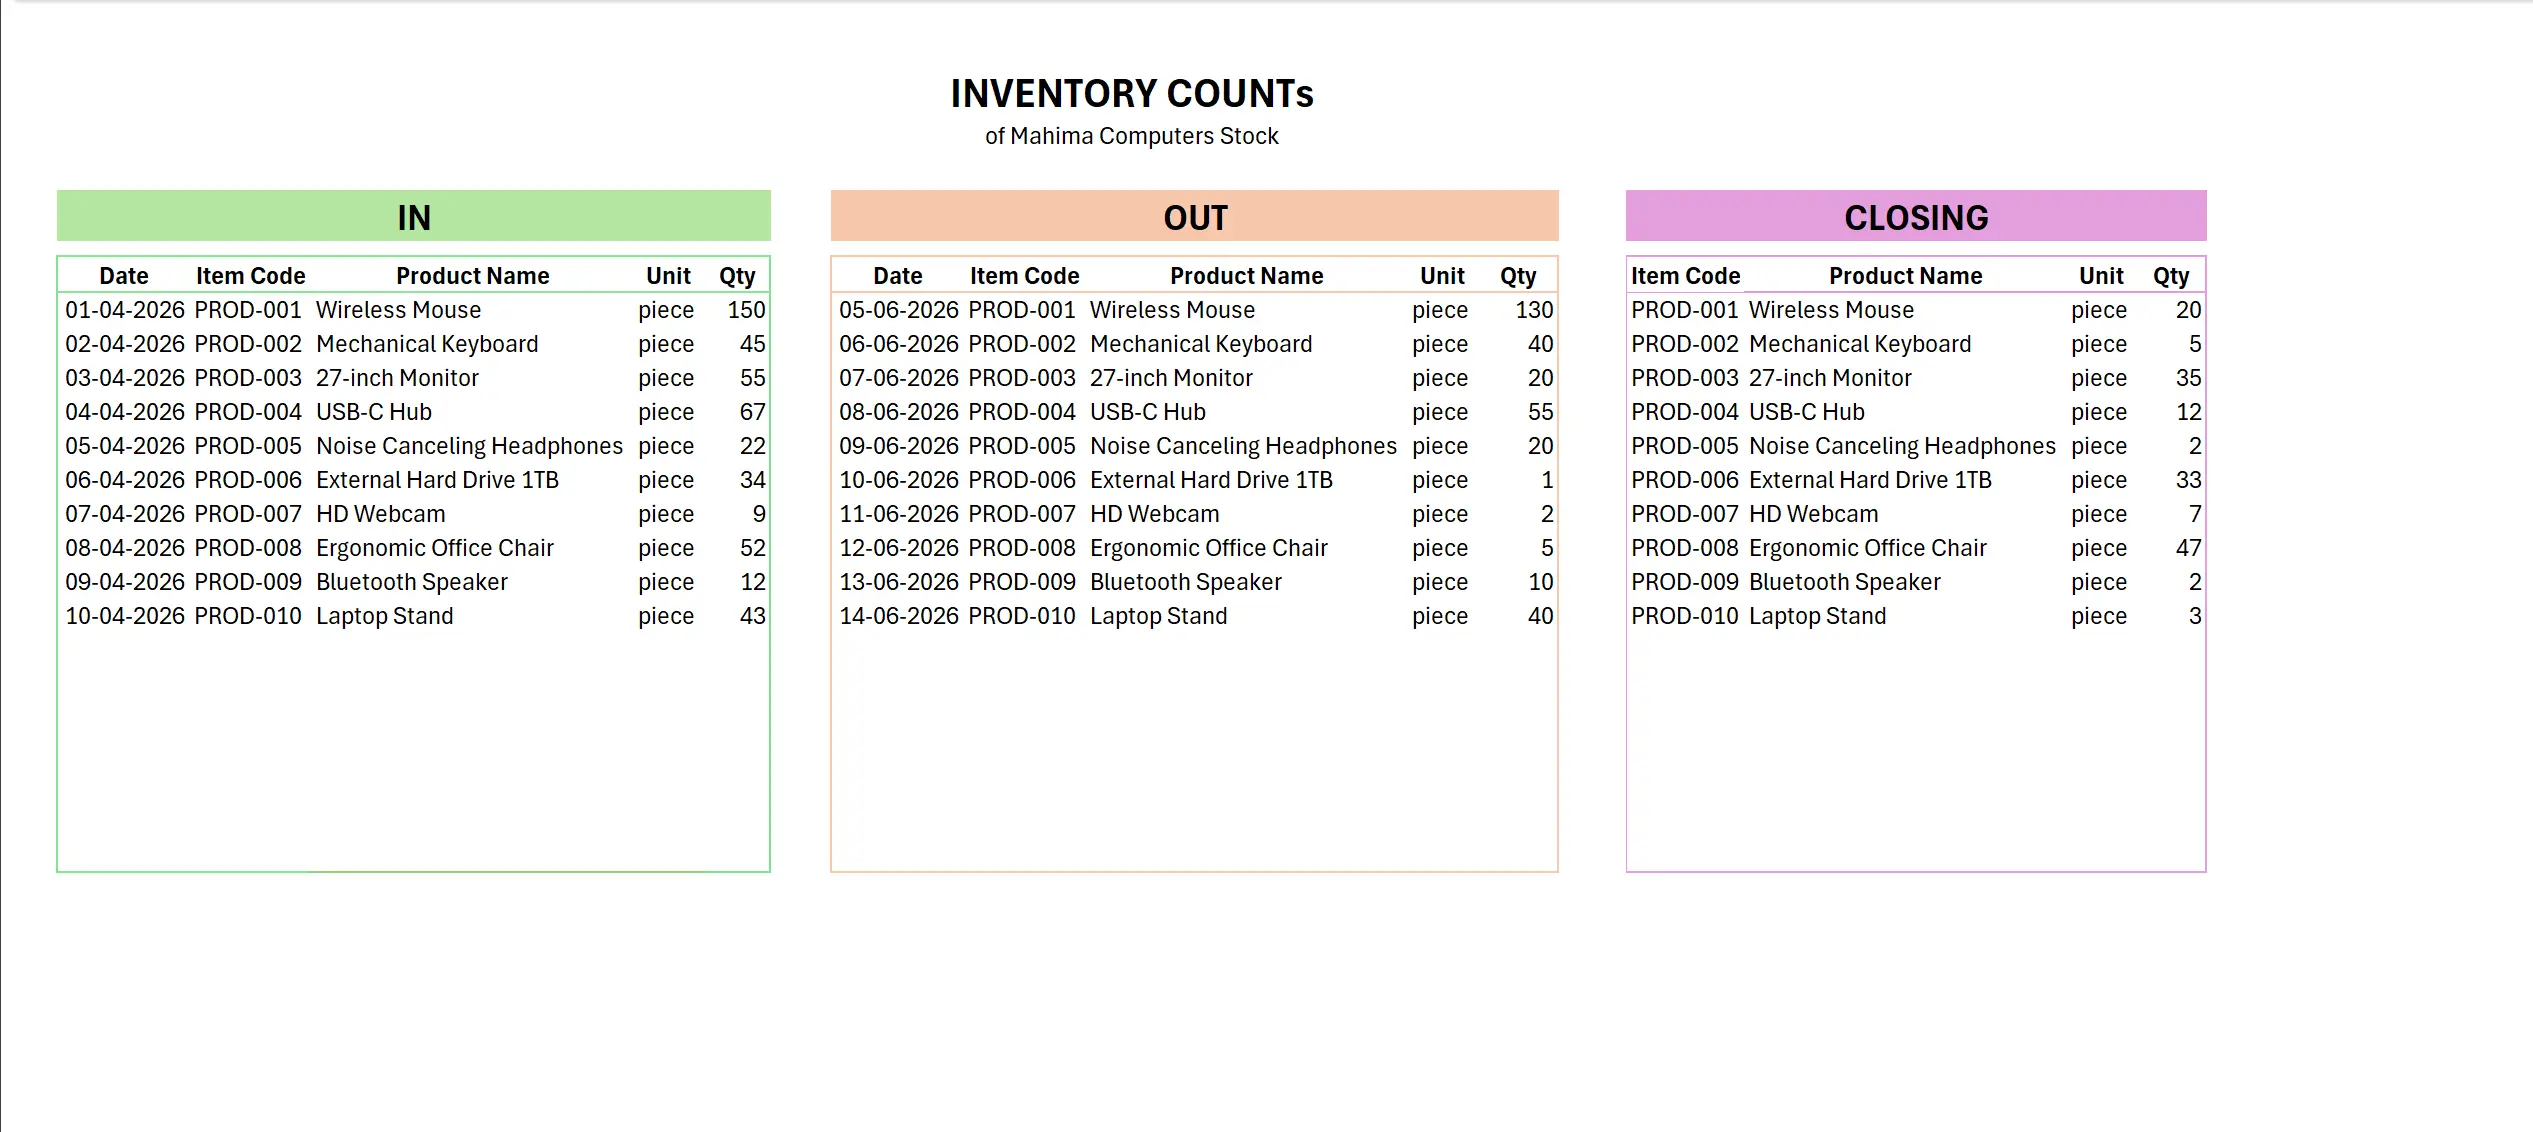
Smart Inventory Stock Management

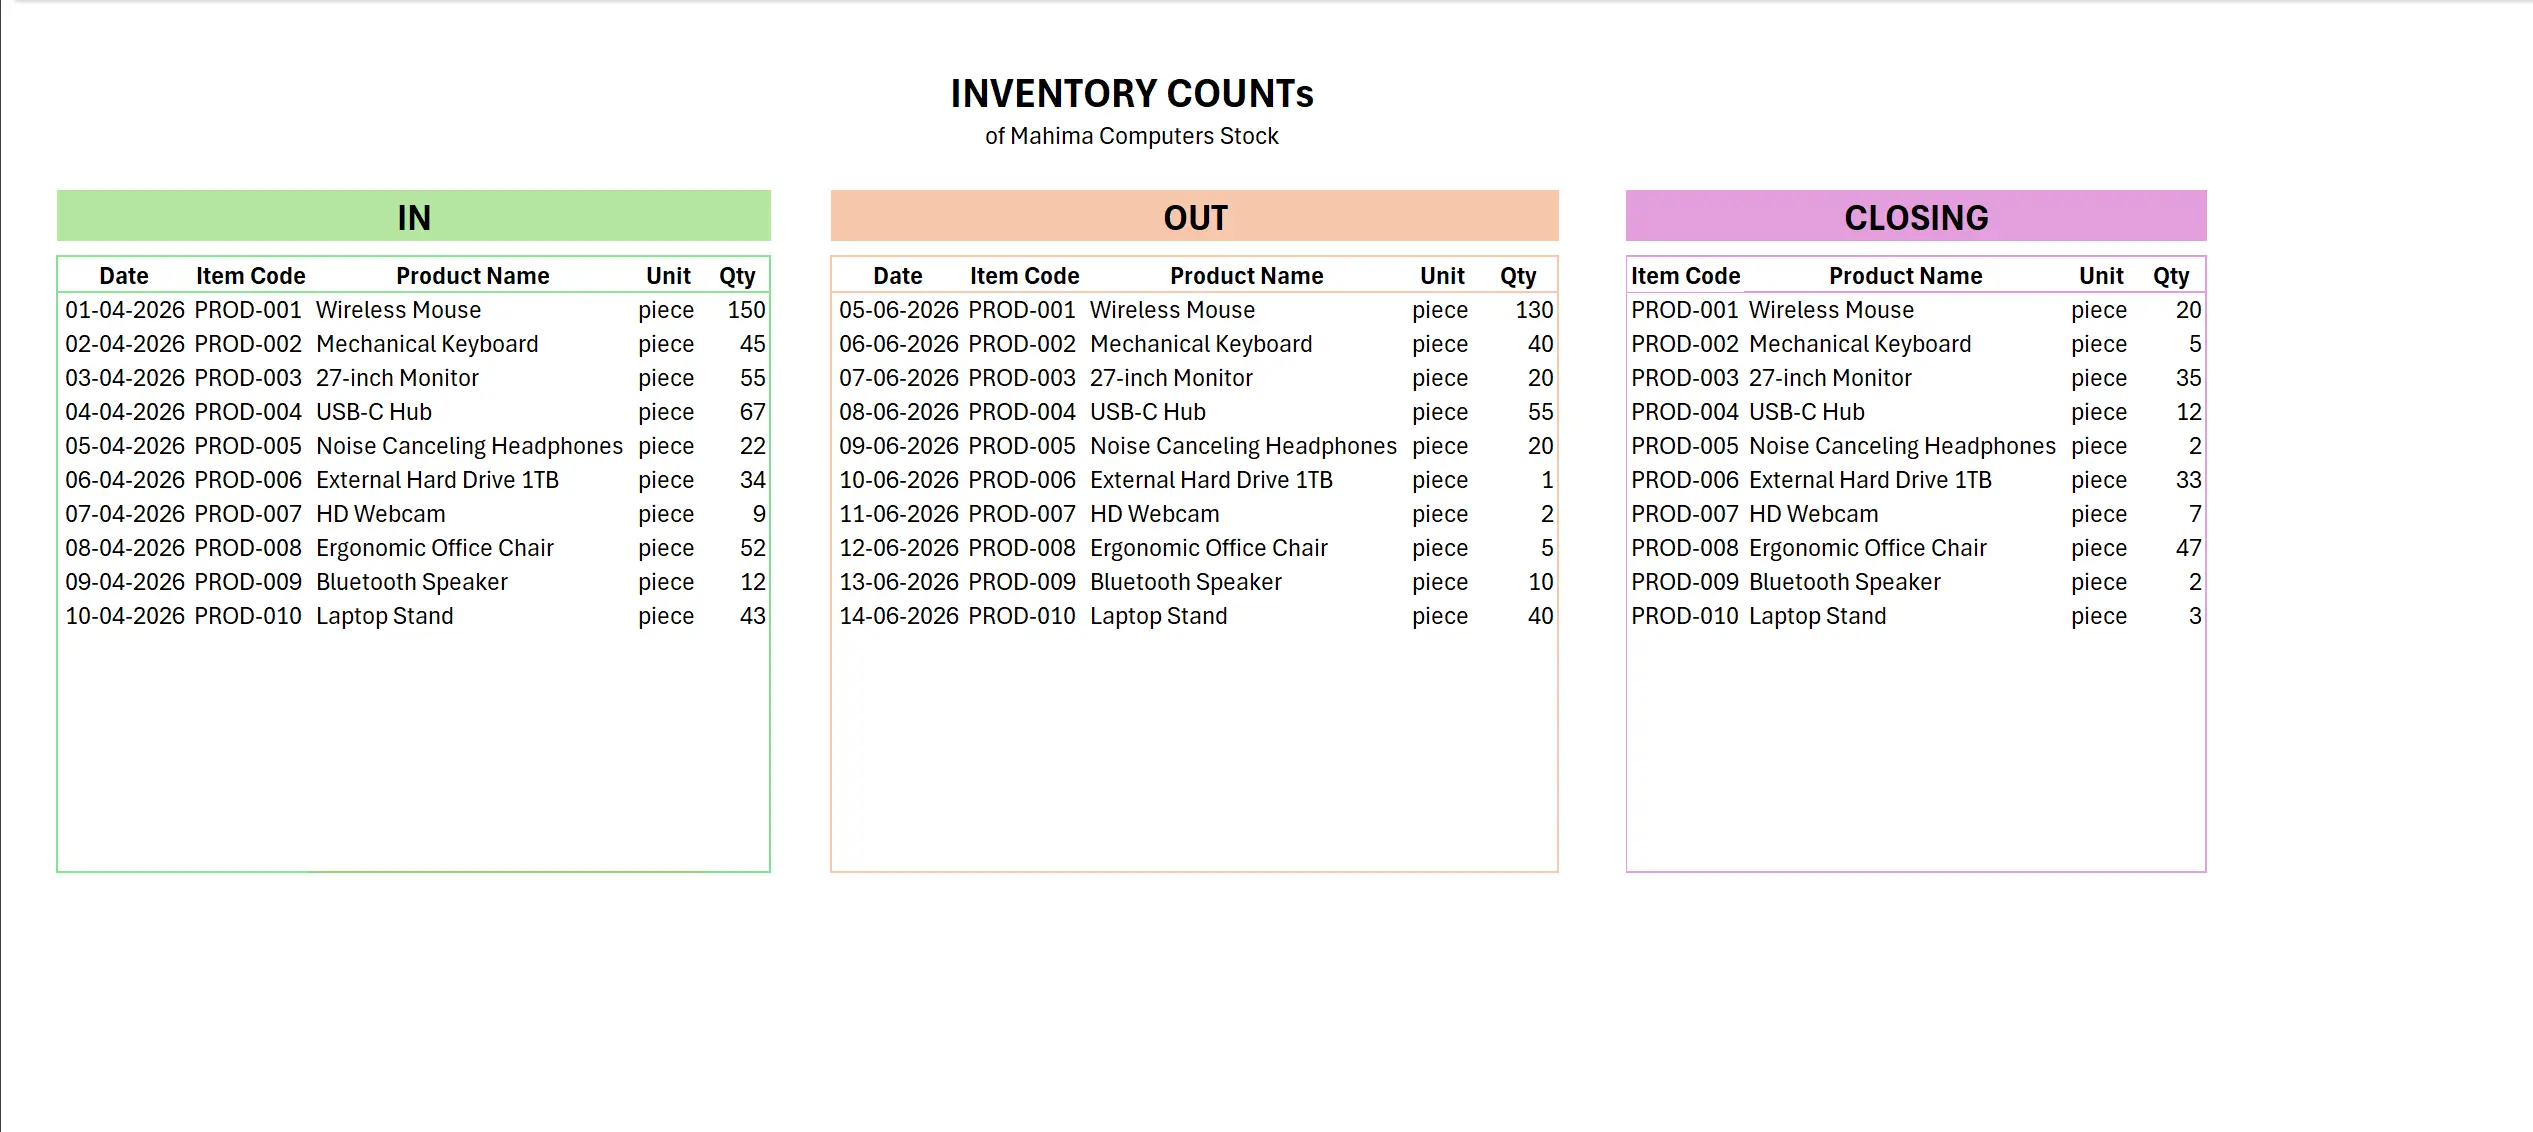
Inventory model tracking 10 SKUs (electronics/office) with IN/OUT stock ledgers, automated reorder points, and real-time closing stock. Noise-Canceling Headphones show near sell-out (2 units closing), while 27-inch Monitors maintain healthy 35-unit buffer. Quantity-based turnover analysis supports just-in-time replenishment.

Identified high-velocity SKUs (Mouse: 130/150 sold, Headphones: 20/22 sold) with sell-through rates above 86% triggering automatic reorder flags. Monitor (36% closing ratio) and Hard Drive (97% closing ratio) exposed contrasting inventory strategies — enabling category-specific stock policies that could reduce carrying costs by 15-20%.
Smart Inventory Stock Management
Download Model