PowerBI Dashboards & Data Visualization | Anjani Kumar Mishra
My PowerBI Projects
A collection of interactive data visualization dashboards built for corporate finance,
sales analytics, regional performance tracking, and business intelligence reporting.
PowerBI Dashboard Projects
prism_store.pbix
HomeInsertDataModelViewPublish
fx
=CALCULATE(SUM(Sales), FILTER(Region))
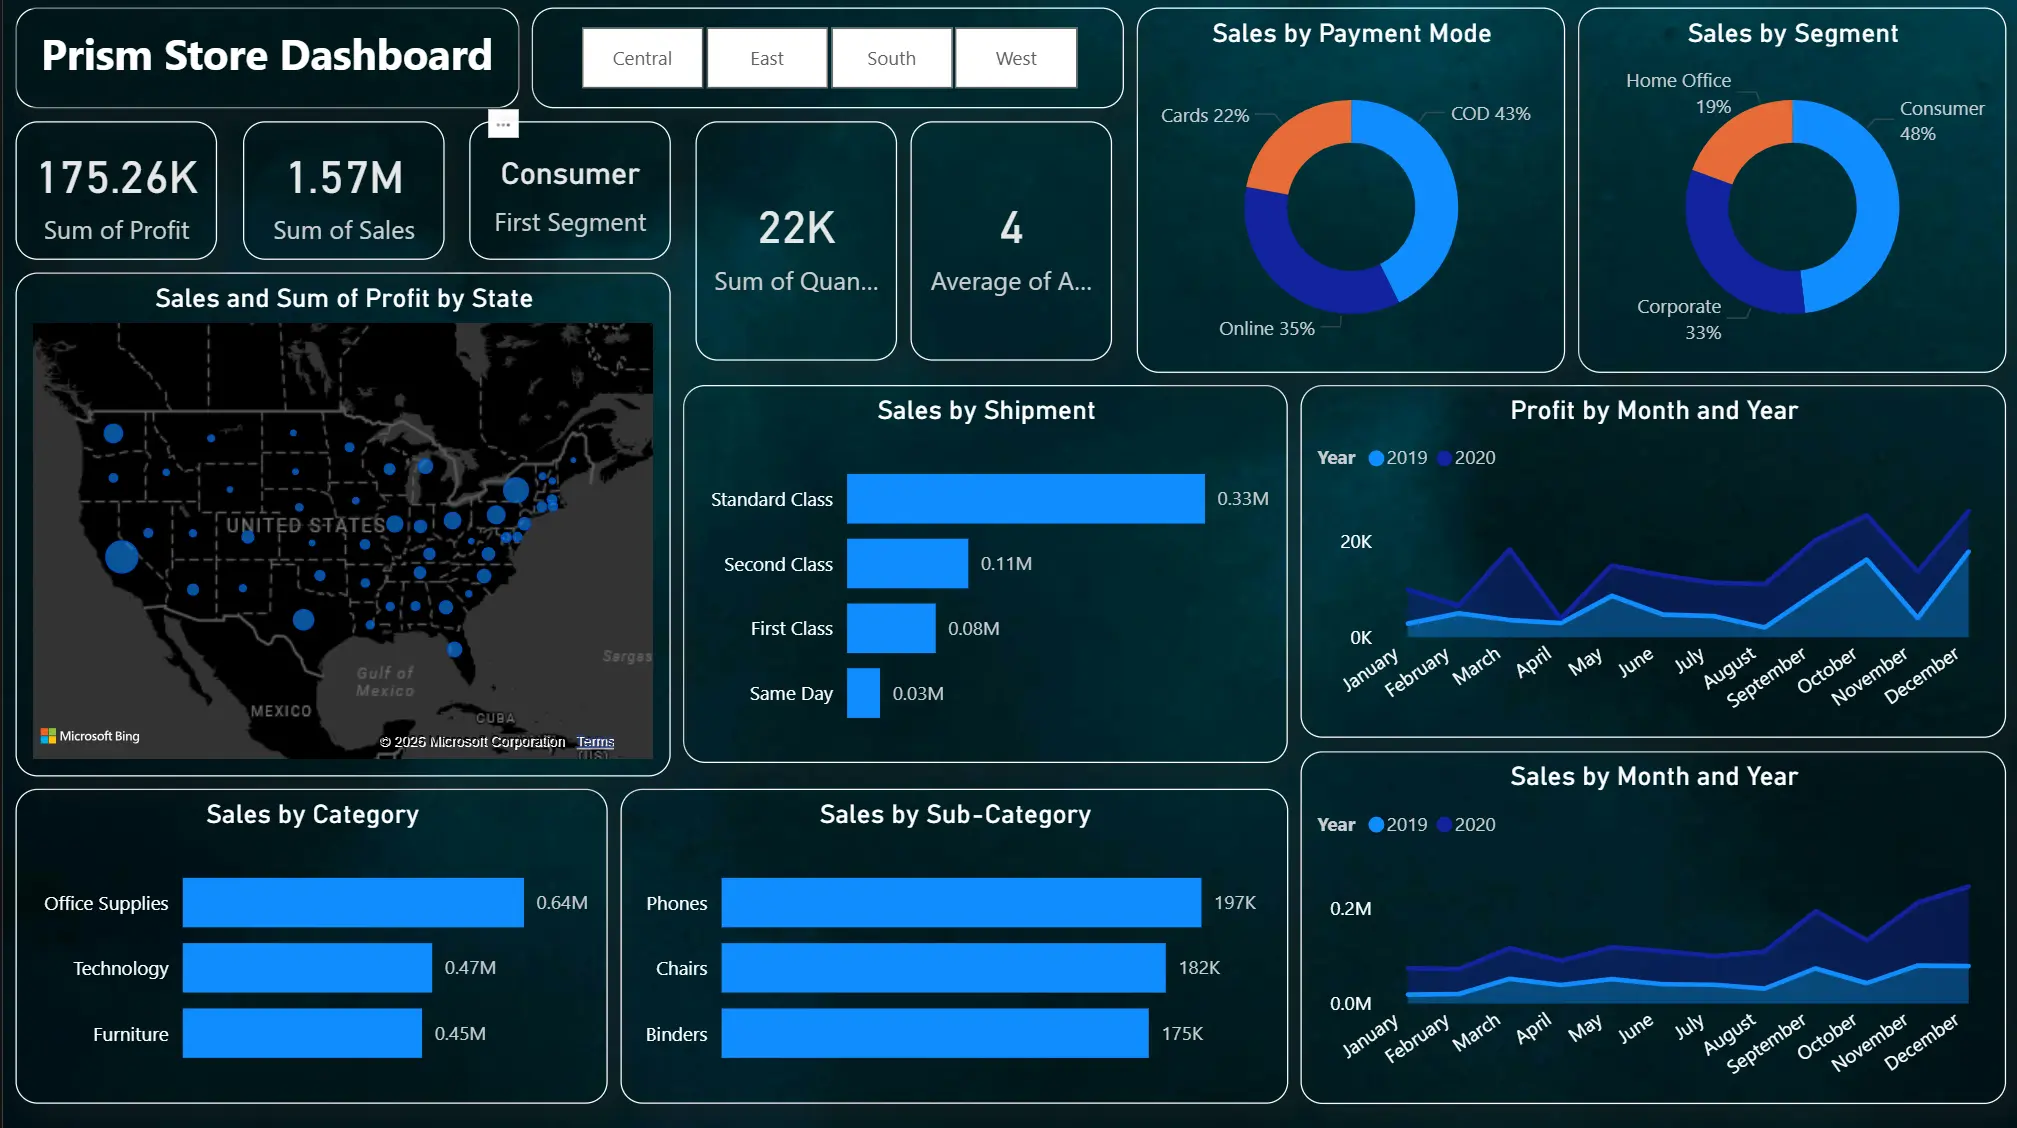
Prism Store Sales
Interactive sales dashboard analyzing revenue across distinct categories and
regions,
highlighting best-performing segments and overarching trends.
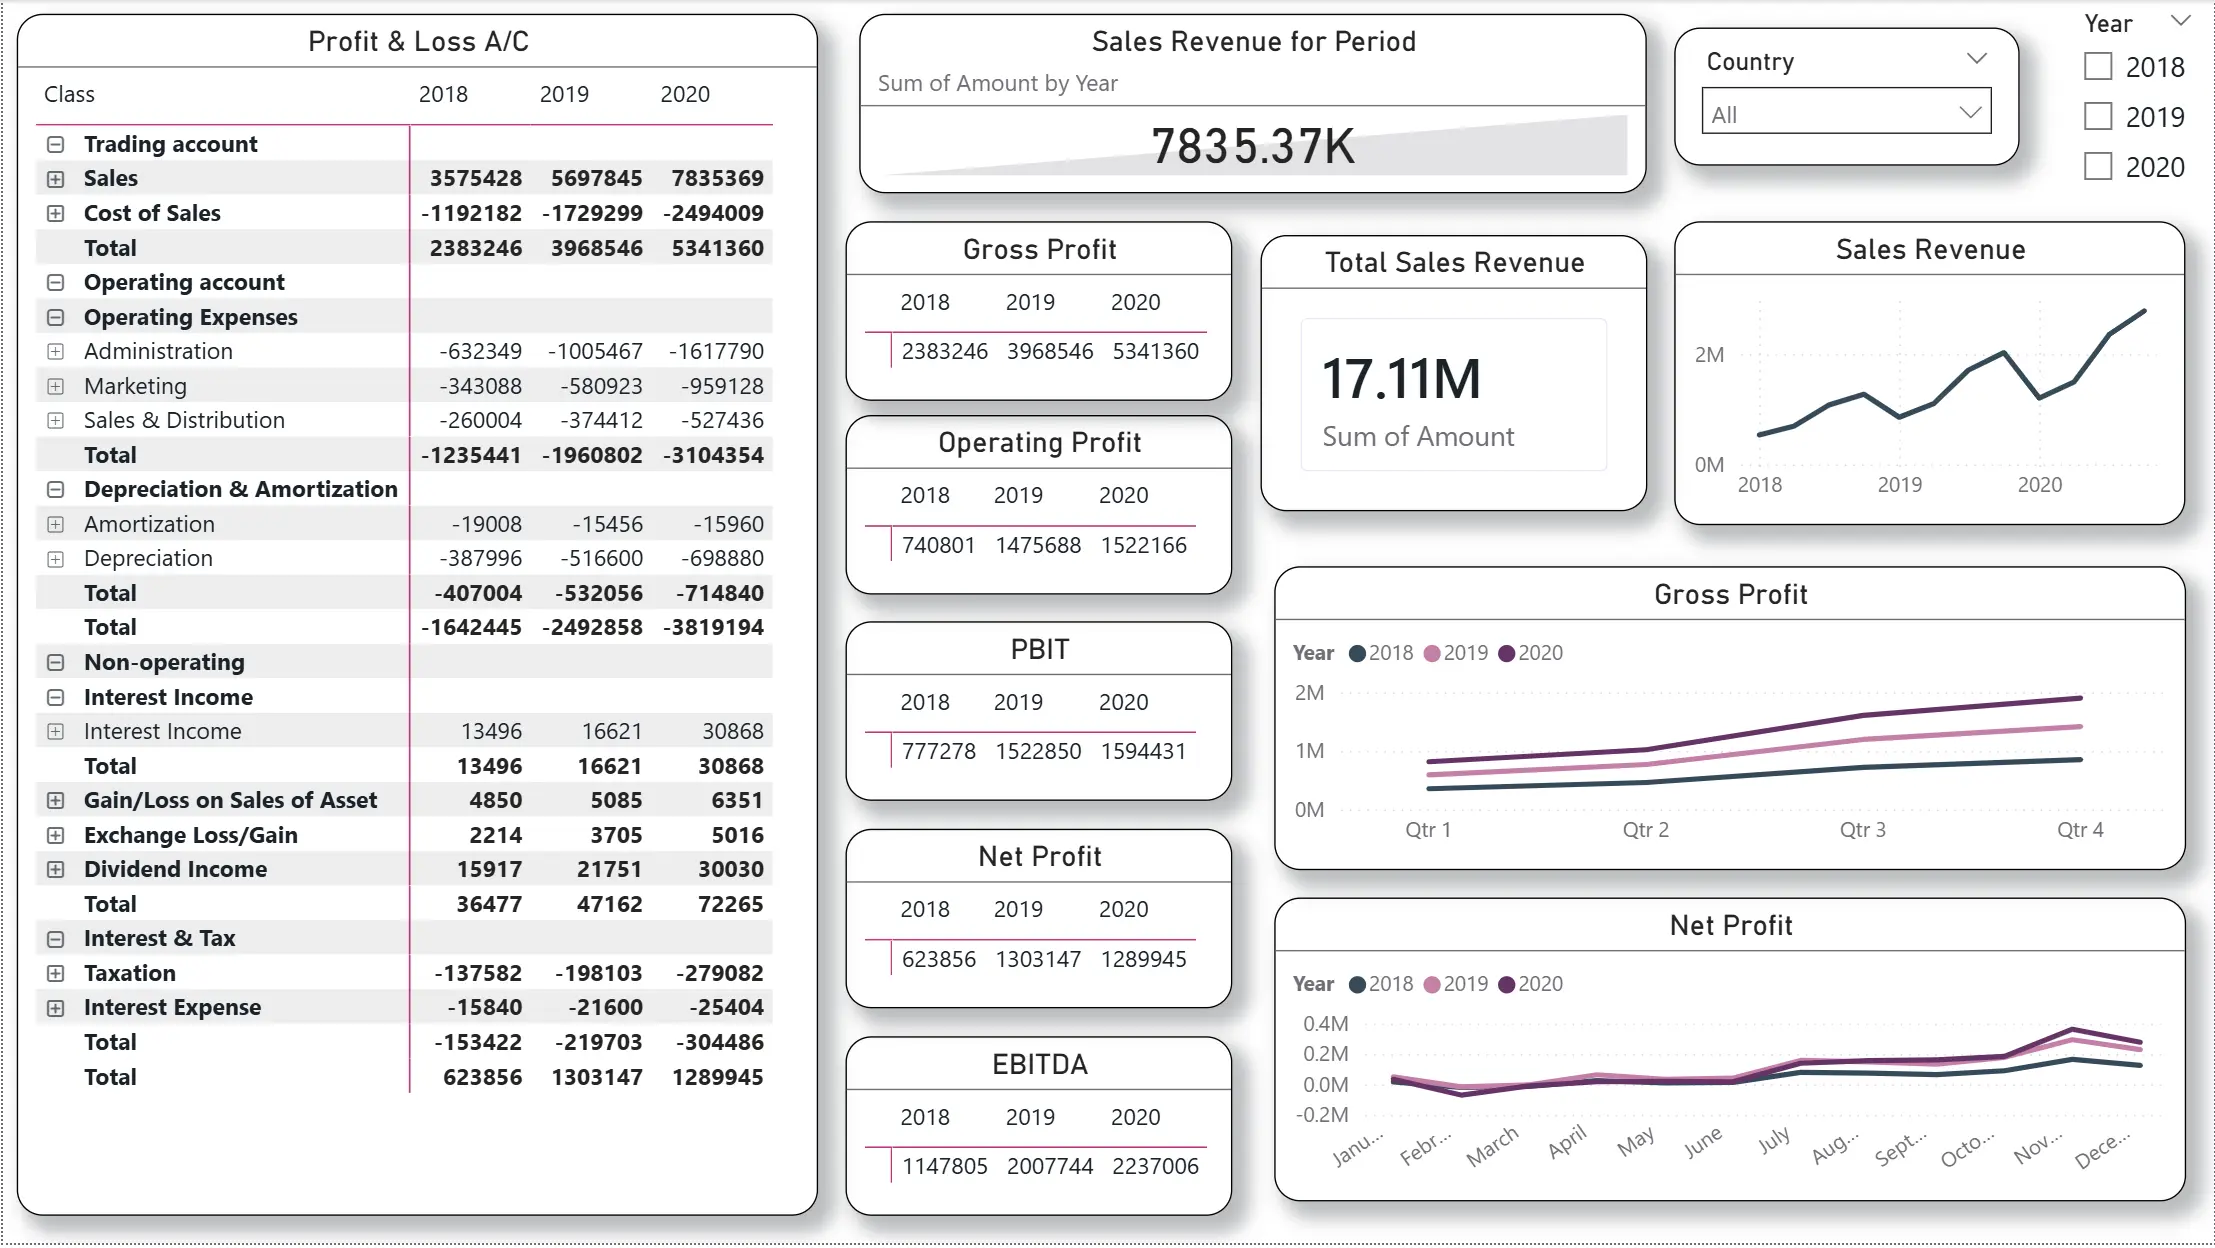
An advanced financial management reporting dashboard structured to visualize complex
FP&A metrics,
cash flow tracking, and operational budgets using DAX measures and Power Query
transformations.
Global billionaires dataset analysis mapping wealth accumulation,
industry dominances, and demographic distributions worldwide.
Currently under active development.
carlimit_bi.pbix
HomeInsertDataModelViewPublish
fx
=CALCULATE(SUM(CarData), FILTER(BI_Report))
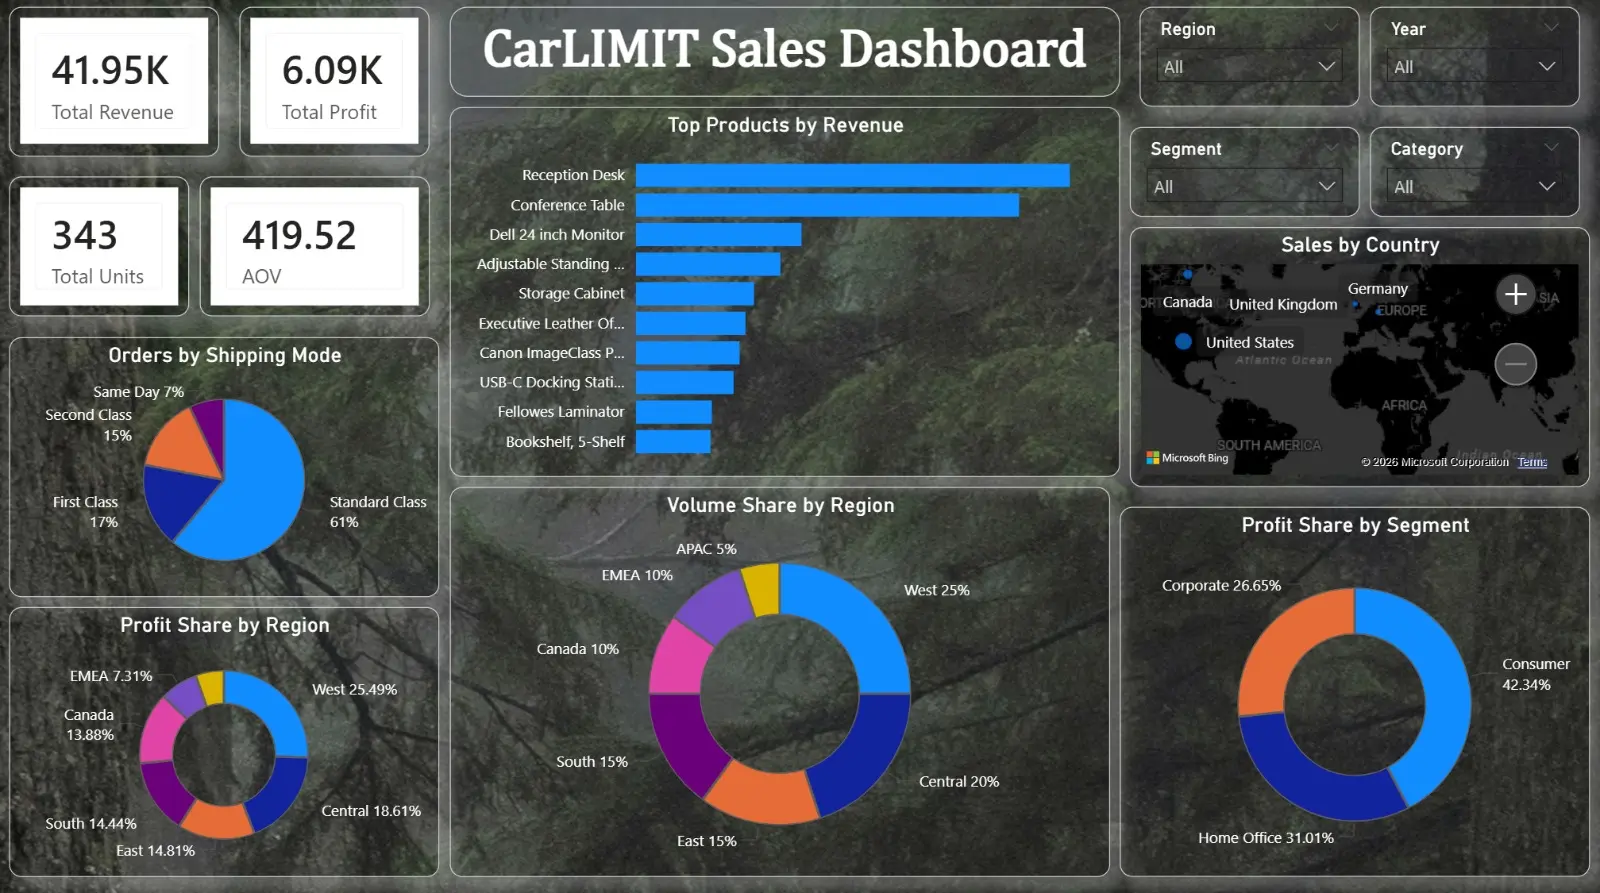
CarLIMIT BI Dashboard
Business intelligence dashboard for CarLIMIT project featuring advanced DAX
calculations, interactive visualizations, and corporate reporting solutions.